Climate Change Effects on Tree Species
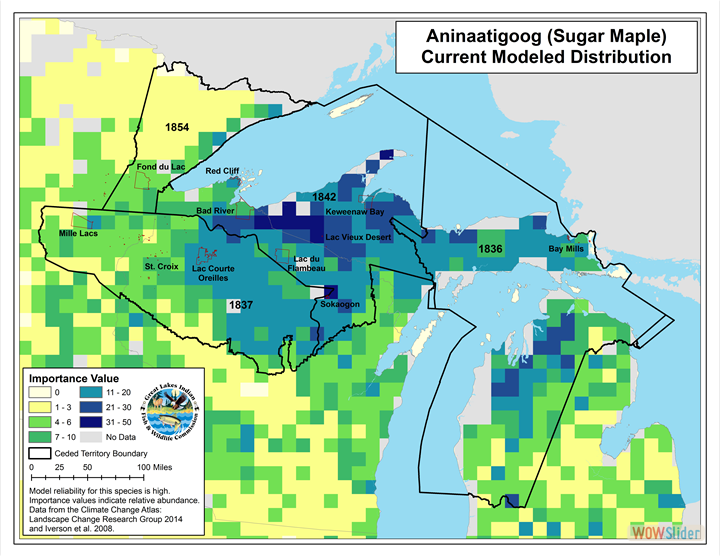
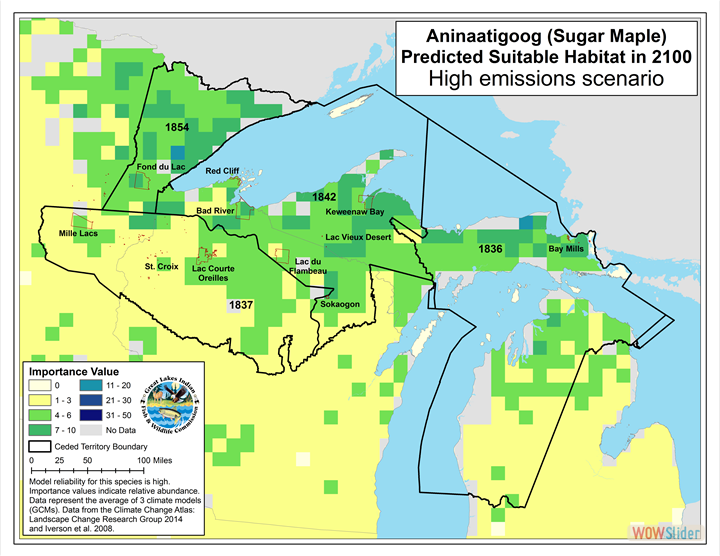
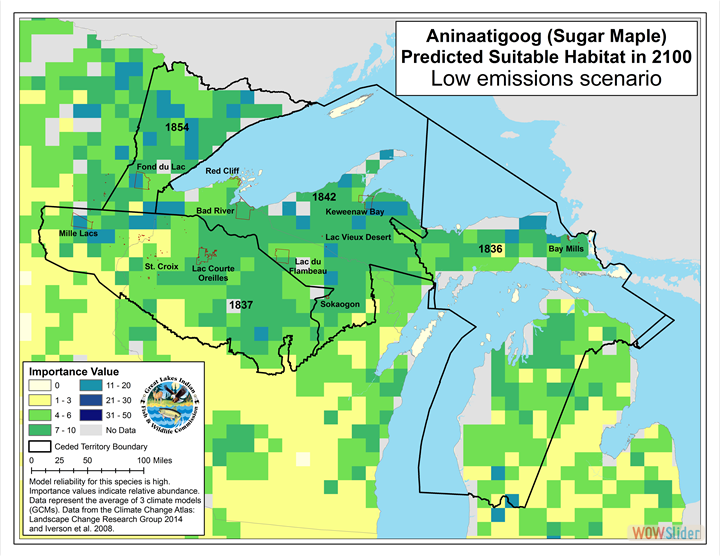
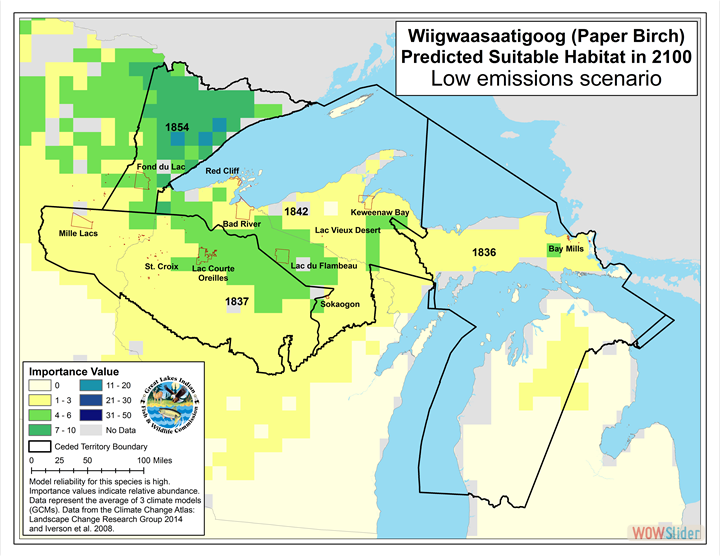
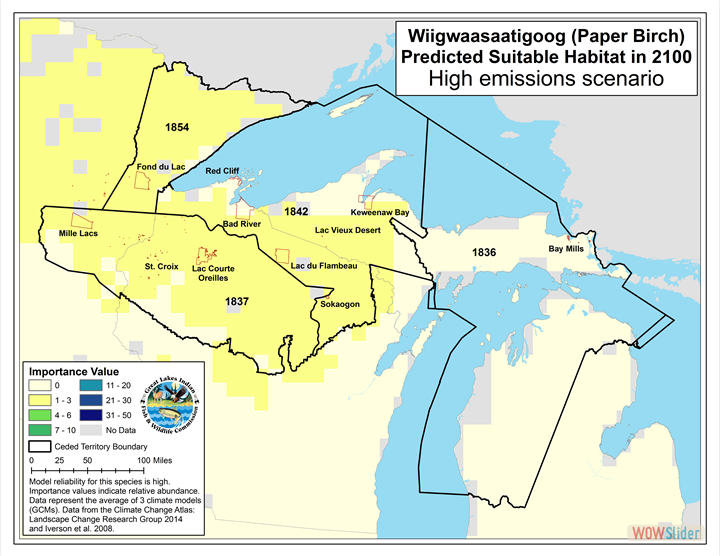
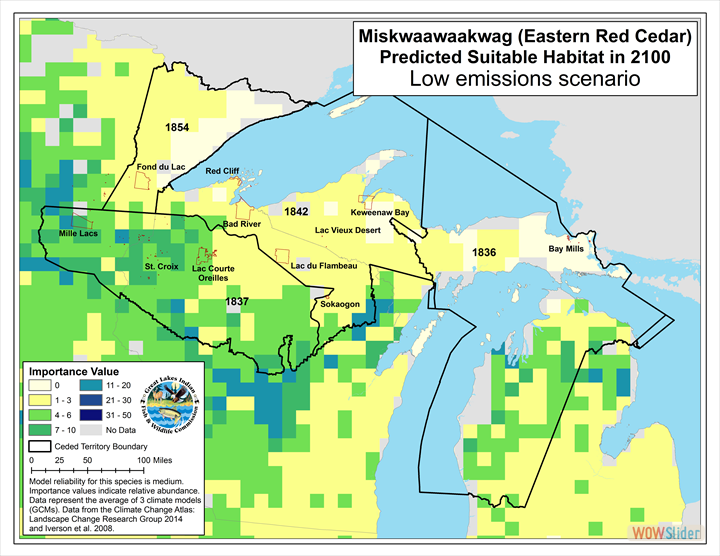
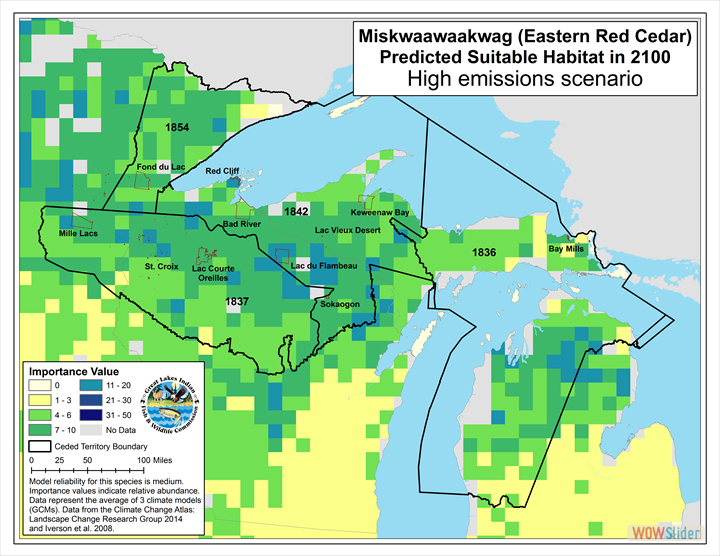
These maps show the projected distribution of sugar maple, paper birch and Eastern red cedar in the Ceded Territories under current, low, and high emission scenarios. Data are from the Climate Change Atlas.
Sugar MapleClick the arrows or bottom numbers to view the other images
The Climate Change Atlas documents current and possible future distribution of tree and bird species across the eastern United States. The Climate Change Tree Atlas model uses climate, soil, elevation and land use data to map predicted suitable habitat of 134 tree species by the year 2100. The model output is displayed as importance values, which can range from 0 (indicating an absence of the species) to 100 (indicating a pure stand of the species). An importance value is a measure of relative abundance – the higher the importance value, the more suitable the habitat is predicted to be.
Paper Birch
Note that these maps do not show where tree species will actually grow in 2100; they show only where suitable habitat is likely to be, according to current climate models. This does not mean a tree species will not be able to grow in areas with low predicted importance values. Another point to consider is that the model is able to predict future suitable habitat better for some species than for others. Therefore, a reliability score is associated with the output for each species (e.g., model reliability is high for paper birch). Finally, the model does not consider disturbances, such as forest pests, fires, or storms. For more information or to look at predictions for other species, check out the homepage of the Climate Change Atlas (http://www.fs.fed.us/nrs/atlas).
Eastern Red Cedar |

 1
1 2
2 3
3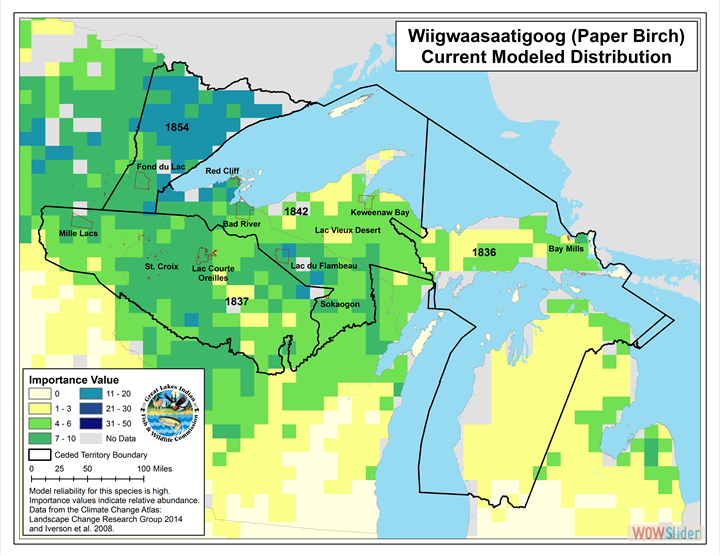
 1
1 2
2 3
3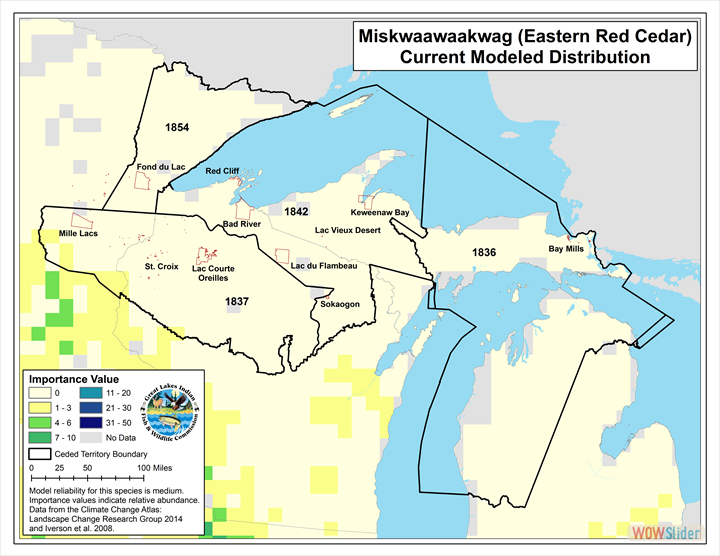
 1
1 2
2 3
3